
In this tutorial, we will apply classification on the same EEG data as in the previous cases, Single-Paricipant Analysis and Group-Level Analysis, but taking advantage of the temporal dimension of the data.
In the previous tutorials (Single-Paricipant Analysis and Group-Level Analysis) we examined whether it is possible to classify EEG responses to different stimuli, at all. However, the classification was agnostic of time. It just informed that somewhere in the brain, at some point in time, there were differential EEG responses to different stimuli (to check).
Here, we go one step further, and ask the questions:
- (a) Can we classify EEG resposnes to different images?
- (b) When in time is there discriminant EEG activity?
To answer these questions, we will use the same algorithms as in the previous tutorials (Single-Paricipant Analysis and Group-Level Analysis), but this time, we will train one classifier at each time instance and we will evaluate the performance of the model at each time instance in new epochs.
The function SlidingEstimator in MNE package is provided for this purpose. This takes the model and optionally a scoring function as parameters to create a time-point by time-point classifier. After having created a sliding estimator, it can be fitted to the data, scored the estimator on each task or made predictions on new epochs.
# To silence the warnings
def warn(*args, **kwargs):
    pass
import warnings
warnings.warn = warn
import mne
from mne.decoding import SlidingEstimator, cross_val_multiscore
from mne.decoding import Vectorizer

from os.path import isfile, join
from os import listdir
import numpy as np
import statistics

from sklearn.preprocessing import StandardScaler
from sklearn.pipeline import make_pipeline
from sklearn.model_selection import cross_val_score, train_test_split, GridSearchCV, StratifiedKFold
from sklearn.metrics import precision_recall_fscore_support, accuracy_score

# Models
from sklearn import svm
from sklearn.discriminant_analysis import LinearDiscriminantAnalysis
from sklearn.linear_model import LogisticRegression
- Prepare data for the analysis
data_folder = '../../study1/study1_eeg/epochdata/'
files = [data_folder+f for f in listdir(data_folder) if isfile(join(data_folder, f)) and '.DS_Store' not in f]
ids = [int(f[len(data_folder)+2:-4]) for f in files]
epochs = [mne.read_epochs(f, verbose='error') for f in files]
epochs_UN = [e['FU', 'FN'] for e in epochs]
epochs_UP = [e['FU', 'FP'] for e in epochs]
epochs_NP = [e['FN', 'FP'] for e in epochs]
# Dataset with unpleasant and neutral events
data_UN = [e.get_data() for e in epochs_UN]
labels_UN = [e.events[:,-1] for e in epochs_UN]

data_UP = [e.get_data() for e in epochs_UP]
labels_UP = [e.events[:,-1] for e in epochs_UP]

data_NP = [e.get_data() for e in epochs_NP]
labels_NP = [e.events[:,-1] for e in epochs_NP]
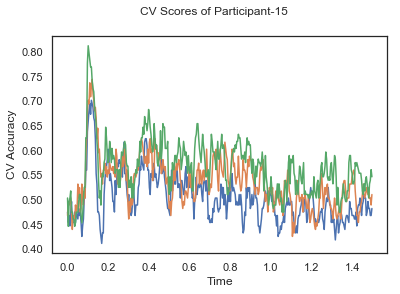
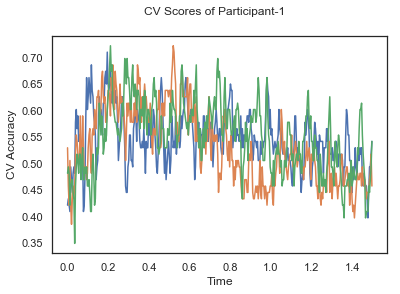
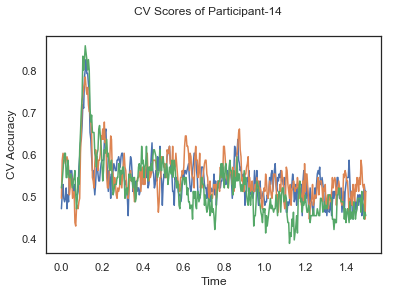
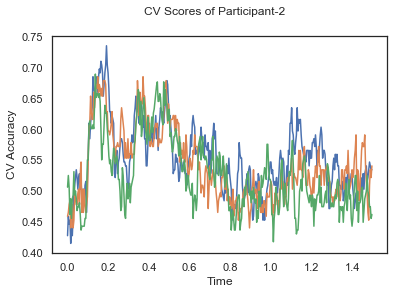
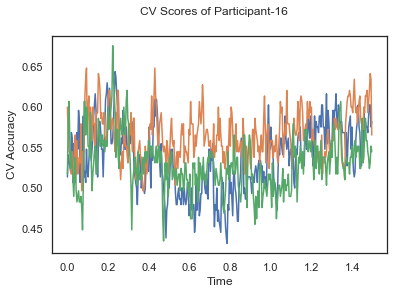
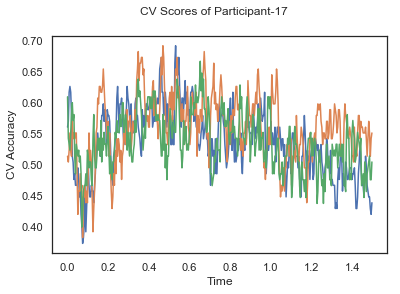
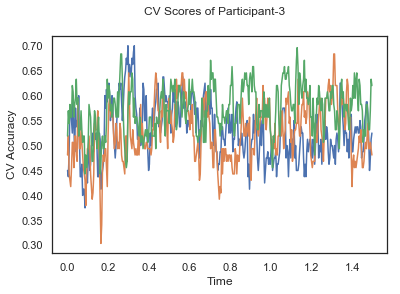
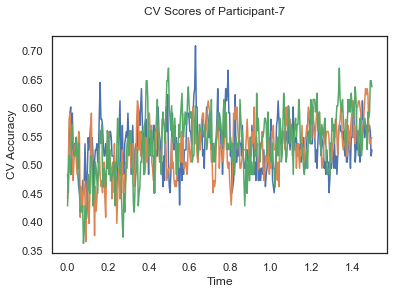
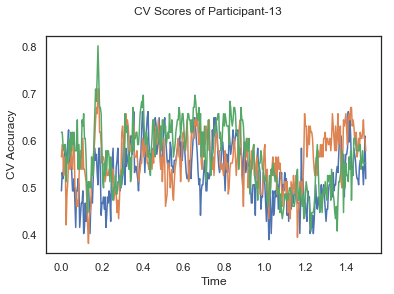
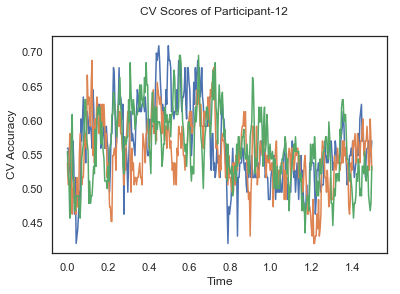
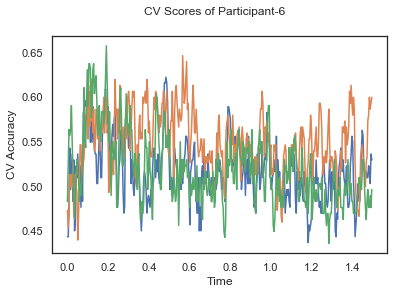
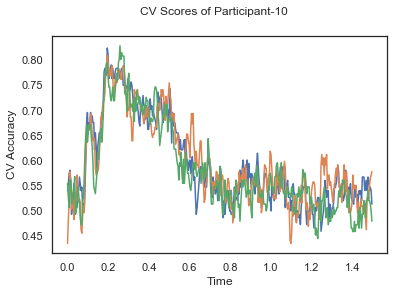
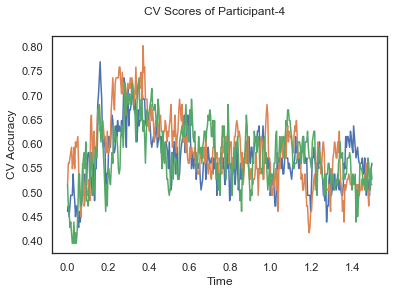
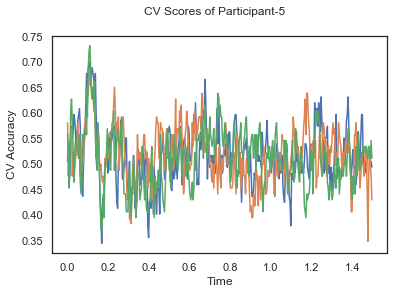
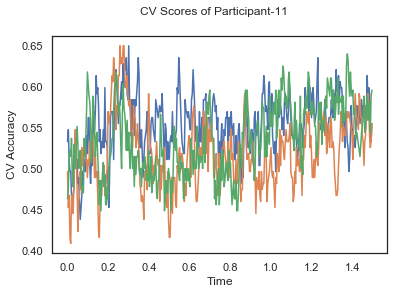
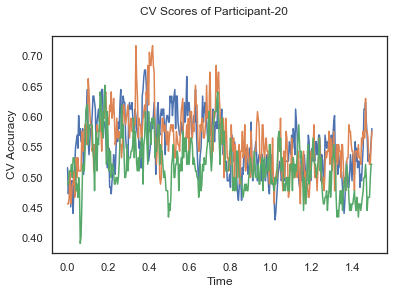
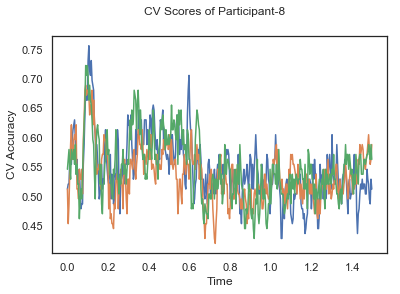
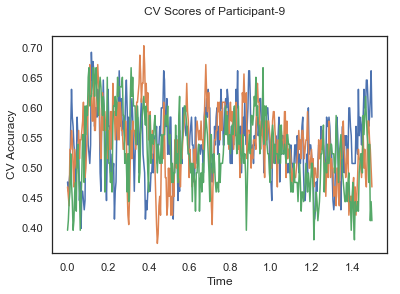
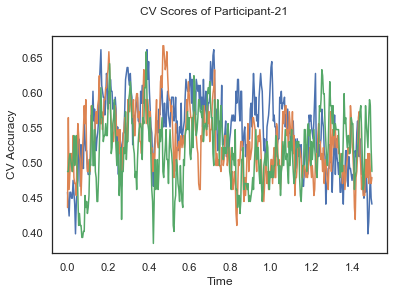
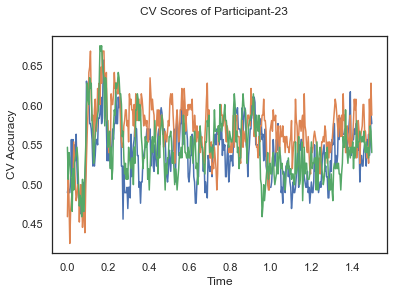
- Train classifiers with sliding window estimator on data of each participant separately and apply 3-fold cross validation.
def applyCrossValidation(data, labels, epochs, ids, classifier):
    CV_score_time = None
    sl = SlidingEstimator(classifier, scoring='accuracy')
    if np.isfinite(data).all() == True and np.isnan(data).any() == False:
        CV_score_time = cross_val_multiscore(sl, data, labels, cv=3)
        plotCVScores(epochs.times, CV_score_time, ids)
    else:
        print('Input contains NaN or infinity!')
    return CV_score_time
import matplotlib.pyplot as plt
%matplotlib inline
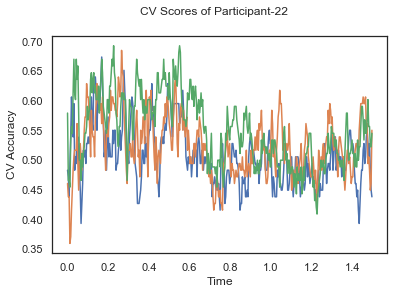
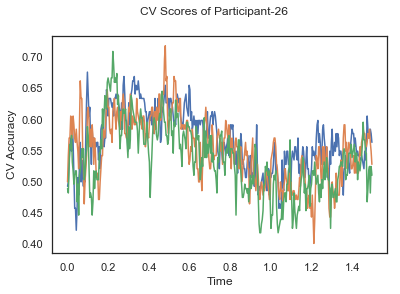
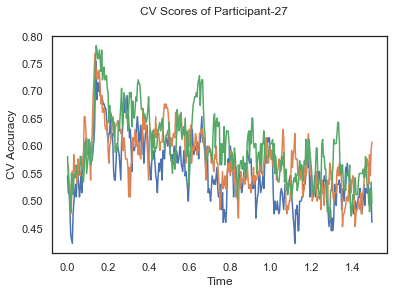
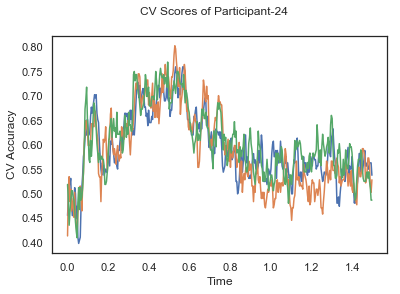
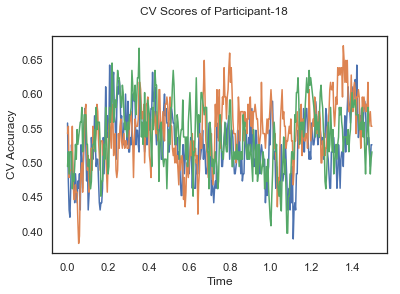
def plotCVScores(times, CV_score_time, id=None):
fig, ax = plt.subplots()
if id != None:
fig.suptitle('CV Scores of Participant-'+str(id))
else:
fig.suptitle('CV Scores')
ax.plot(times, CV_score_time.T)
plt.xlabel('Time')
plt.ylabel('CV Accuracy')
plt.show()
CV_score_time_UN = []
for i in range(len(data_UN)):
    print('Participant id: '+ str(ids[i]))
    clf = make_pipeline(Vectorizer(), StandardScaler(), LinearDiscriminantAnalysis(solver='svd'))
    CV_score_time_UN.append(applyCrossValidation(data_UN[i], labels_UN[i], epochs_UN[i], ids[i], clf))
def averageCVScores(CV_score_time):
    avg_cv_scores = []
    for cv in CV_score_time:
        avg_scores_tmp = []
        sum_col_wise = cv.sum(axis=0)
        avg_scores_tmp = [s/len(cv) for s in sum_col_wise]
        avg_cv_scores.append(avg_scores_tmp)
    return avg_cv_scores
avg_cv_score_time = averageCVScores(CV_score_time_UN)
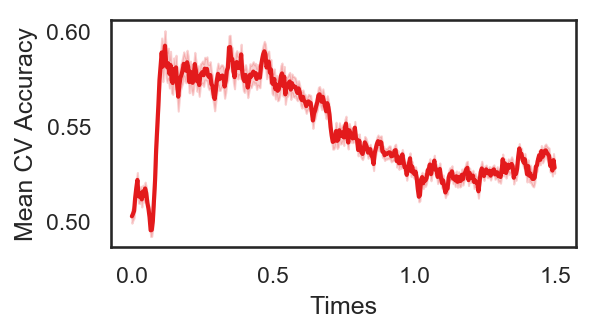
The following cell plots the mean and standard deviation of cross validation accuracies of participants.
import pylab, numpy as np, seaborn as sns, matplotlib.pyplot as plt
from scipy.stats import ttest_rel, sem

def plot_conditions(data,epochs,labels):

    sns.set(style="white")
    ColorsL = np.array(([228,26,28], [55,126,184], [77,175,74], [152,78,163], [255,127,0]))/256
    col_axes = np.array((82, 82, 82))/256

    al = 0.2
    fig = plt.figure(num=None, figsize=(4, 2), dpi=150)


    epochs_mean = np.mean(data, axis = 0)
    epochs_std = sem(data, axis = 0)/2

    plt.plot(epochs[0].times, epochs_mean, color = ColorsL[0], linewidth = 2, label = labels)
    plt.fill_between(epochs[0].times, epochs_mean, epochs_mean + epochs_std, color = ColorsL[0], interpolate=True, alpha = al)
    plt.fill_between(epochs[0].times, epochs_mean, epochs_mean - epochs_std, color = ColorsL[0], interpolate=True, alpha = al)
    plt.ylabel('Mean CV Accuracy')
    plt.xlabel('Times')
Mean cross validation accuracy plot below is showing that above chance (50%) accuracy achived at each time points.
avg_cv_score_time = np.asarray(avg_cv_score_time)
plot_conditions(avg_cv_score_time,epochs_UN, labels_UN)
How do you improve the results?
Exercise: Apply filtering and also parameter optimization for LDA classifier to see the potential effects
As in the previous tutorial (Group-Level Analysis) , participants' data are concatenated for forming the dataset required for group-level analysis.
#Load Dataset
data_folder = '../../study1/study1_eeg/epochdata/'
files = [data_folder+f for f in listdir(data_folder) if isfile(join(data_folder, f)) and '.DS_Store' not in f]
#files = files[:10]
ids = [int(f[-6:-4]) for f in files]

numberOfEpochs = np.zeros((len(ids), 3))
# Read the EEG epochs:
epochs_all_UN, epochs_all_UP, epochs_all_NP = [], [], []
for f in range(len(files)):
    epochs = mne.read_epochs(files[f], verbose='error')
    epochs_UN = epochs['FU', 'FN']
    epochs_UP = epochs['FU', 'FP']
    epochs_NP = epochs['FN', 'FP']
    numberOfEpochs[f,0] = int(len(epochs_UN.events))
    numberOfEpochs[f,1] = int(len(epochs_UP.events))
    numberOfEpochs[f,2] = int(len(epochs_NP.events))
    UN, UP, NP = [ids[f]], [ids[f]], [ids[f]]
    UN.append(epochs_UN)
    UP.append(epochs_UP)
    NP.append(epochs_NP)
    epochs_all_UN.append(UN)
    epochs_all_UP.append(UP)
    epochs_all_NP.append(NP)

epochs_all_UN = np.array(epochs_all_UN)
epochs_all_UP = np.array(epochs_all_UP)
epochs_all_NP = np.array(epochs_all_NP)
After having the dataset; data, labels and ids(participant ids) are separated by the folowing function.
def getData_labels(epochs):
    data, labels, ids = [], [], []
    for p in epochs:
        tmp_epoch = p[1]
        tmp_labels = tmp_epoch.events[:,-1]
        labels.extend(tmp_labels)
        tmp_id = p[0]
        ids.extend([tmp_id]*len(tmp_labels))
        data.extend(tmp_epoch.get_data())

    data = np.array(data)
    labels = np.array(labels)
    ids = np.array(ids)
    return data, labels, ids
Before starting the model building phase, data should be checked if it contains an invalid value which can be plus/minus infinite or NaN because python's sklearn package cannot handle those values while building models. If the following cell returns "Nan or inifinite is detedted!", you need to check your dataset before moving the next step. Note that, it may occur that the data contains no NaN or infinite value but sklearn may still give error claiming the opposite. The reason for this error is that there are some values in your dataset which have higher precision than float64 or float32 (depending your preferance while reading data at the beginning) can handle. To fix this issue you can cast your values to float64 or float32 while reading the dataset.
#Preparing dataset
data_UP, labels_UP, ids_UP = getData_labels(epochs_all_UP)
if np.isfinite(data_UP).all() == True and np.isnan(data_UP).any() == False:
    print('Data does not contain nan or infinite value')
else:
    print('Nan or inifininte is detected!')
clf_UP = make_pipeline(Vectorizer(), StandardScaler(), LinearDiscriminantAnalysis(solver='svd'))
sl_UP = SlidingEstimator(clf_UP, scoring='accuracy')
if np.isfinite(data_UP).all() == True and np.isnan(data_UP).any() == False:
    CV_score_time = cross_val_multiscore(sl_UP, data_UP, labels_UP, cv=3)
    print('Cross validation scores:\n {}'.format(CV_score_time))
else:
    print('Input contains NaN or infinity!')
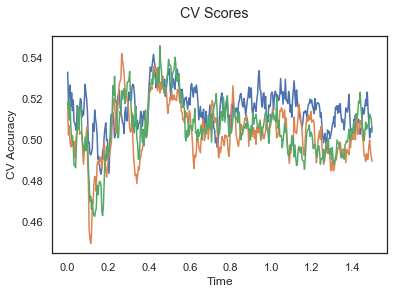
plotCVScores(epochs_UP.times, CV_score_time)
#Preparing dataset
data_UN, labels_UN, ids_UN = getData_labels(epochs_all_UN)
Note that hyper-parameter optimization is not applied due to the computation time constraints and left as an exercise.
clf_UN = make_pipeline(Vectorizer(), StandardScaler(), LinearDiscriminantAnalysis(solver='svd'))
sl_UN = SlidingEstimator(clf_UN, scoring='accuracy')
if np.isfinite(data_UN).all() == True and np.isnan(data_UN).any() == False:
CV_score_time = cross_val_multiscore(sl_UN, data_UN, labels_UN, cv=3)
print('Cross validation scores:\n {}'.format(CV_score_time))
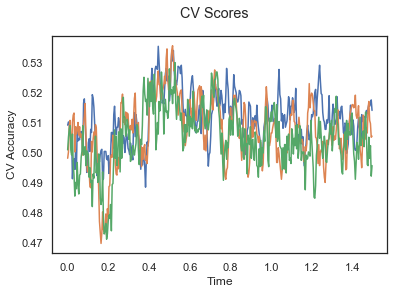
plotCVScores(epochs_UN.times, CV_score_time)
else:
print('Input contains NaN or infinity!')
#Preparing dataset
data_NP, labels_NP, ids_NP = getData_labels(epochs_all_NP)
clf_NP = make_pipeline(Vectorizer(), StandardScaler(), LinearDiscriminantAnalysis(solver='svd'))
sl_NP = SlidingEstimator(clf_NP, scoring='accuracy')
if np.isfinite(data_NP).all() == True and np.isnan(data_NP).any() == False:
    CV_score_time = cross_val_multiscore(sl_NP, data_NP, labels_NP, cv=3)
    print('Cross validation scores:\n {}'.format(CV_score_time))
    plotCVScores(epochs_NP.times, CV_score_time)
else:
    print('Input contains NaN or infinity!')
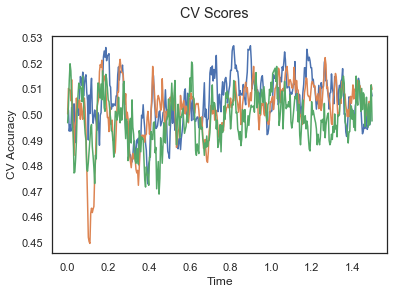
The above three plots show the mean cross validation accuracy over time for each classification task. The accuracies are less than 50% for all time points meaning that models do not perform above chance. In contrast to the group-level cross validation plots, the mean of cross validation scores for all participants over time is higer than 50%. So, we may conclude that high variation between participants leads to poor performance on group-level.